Free Access
Fig. 14
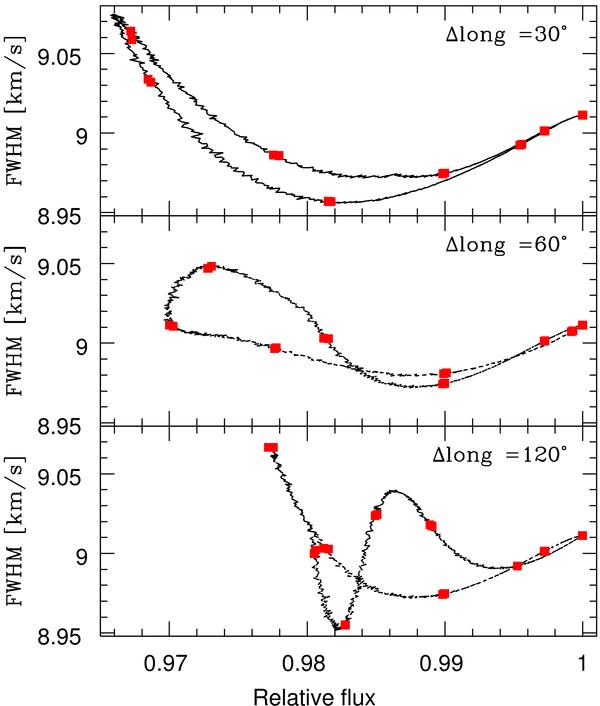
FWHM of the fitted Gaussian as a function of the photometric flux of the three RV variations shown in Fig. 11 when two spots are on the stellar surface. The square points represent a sampling with one measurement each Prot/10.
Current usage metrics show cumulative count of Article Views (full-text article views including HTML views, PDF and ePub downloads, according to the available data) and Abstracts Views on Vision4Press platform.
Data correspond to usage on the plateform after 2015. The current usage metrics is available 48-96 hours after online publication and is updated daily on week days.
Initial download of the metrics may take a while.