Free Access
Fig. 11
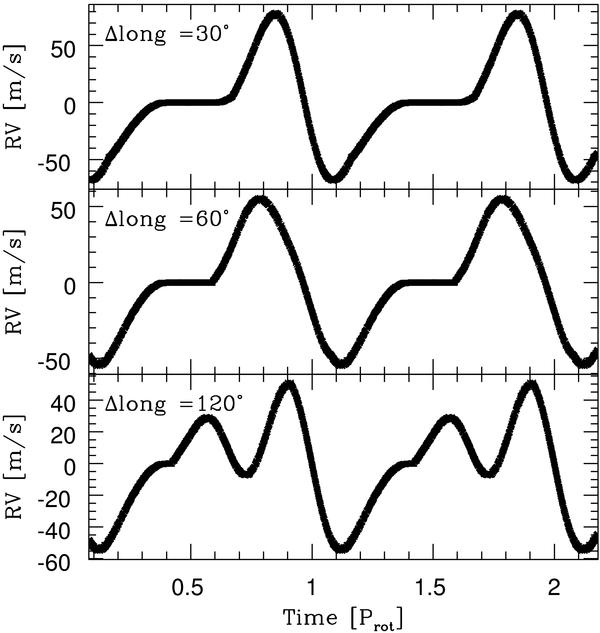
RV as a function of time induced by two spots on the stellar surface. One spot is at latitude +30°, the other at the equator. From top to bottom: the shape of the variation varies with the difference in longitude between the two spots, labelled in the top left of each panel.
Current usage metrics show cumulative count of Article Views (full-text article views including HTML views, PDF and ePub downloads, according to the available data) and Abstracts Views on Vision4Press platform.
Data correspond to usage on the plateform after 2015. The current usage metrics is available 48-96 hours after online publication and is updated daily on week days.
Initial download of the metrics may take a while.