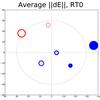
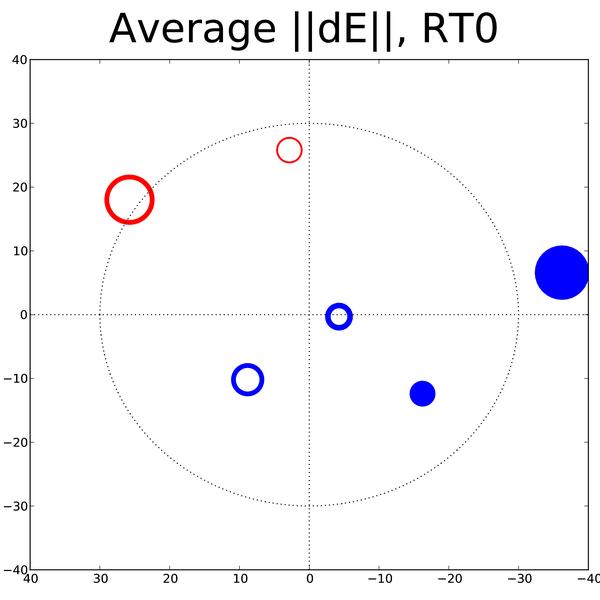
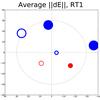
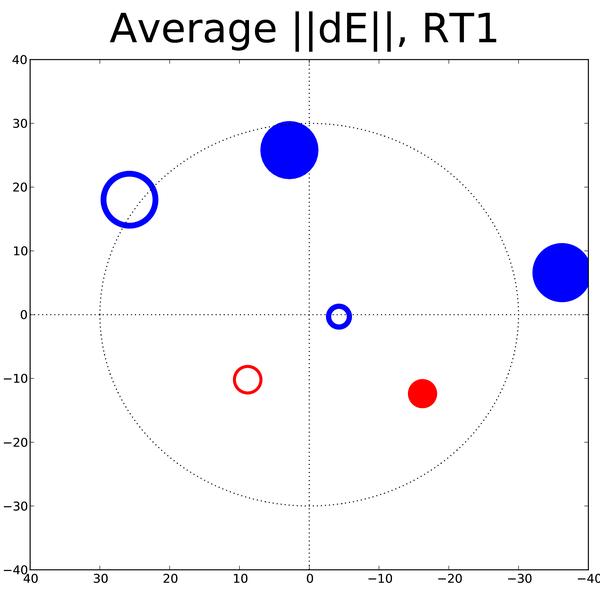
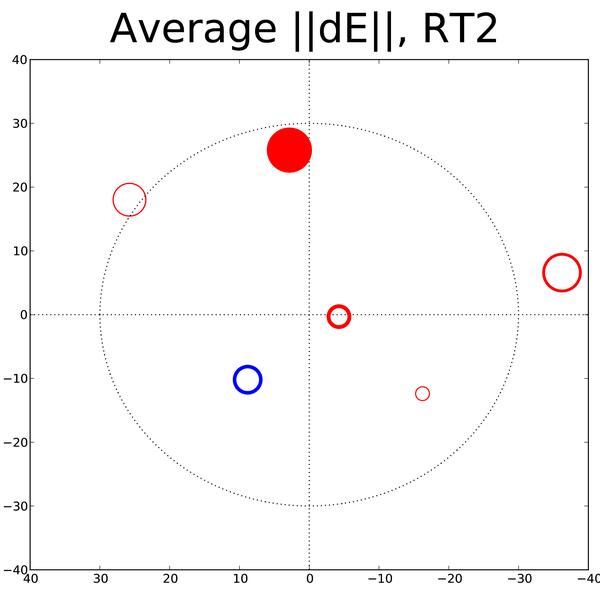
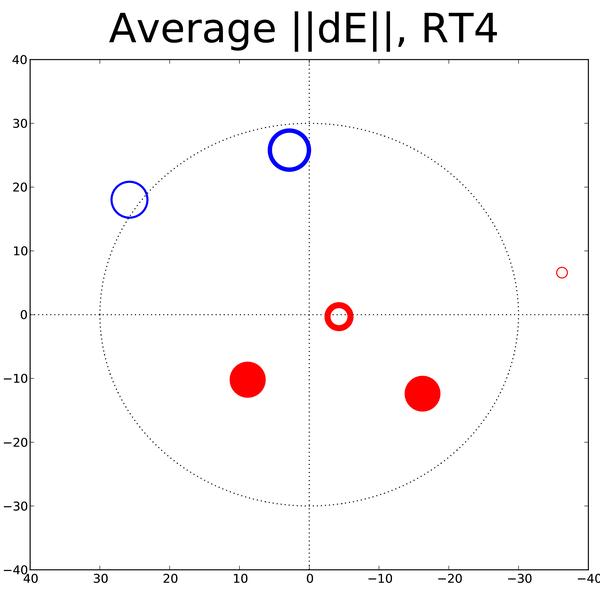
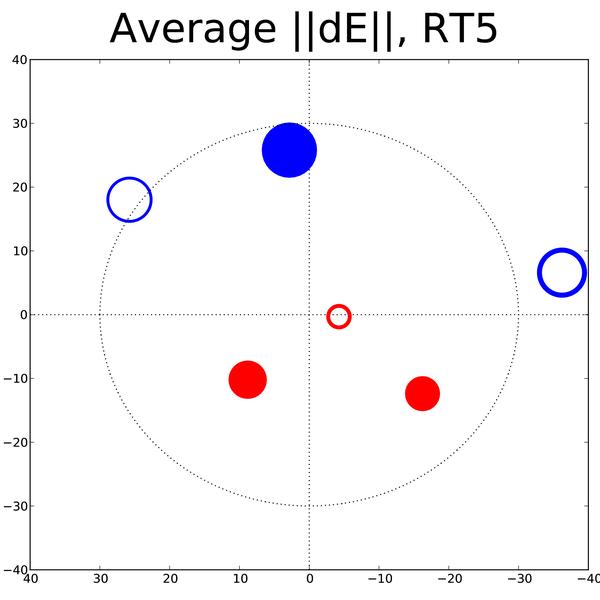
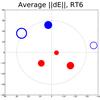
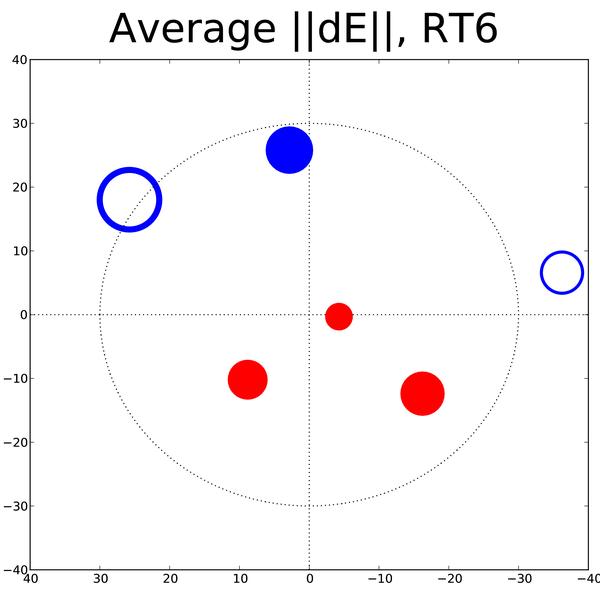
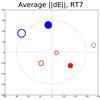
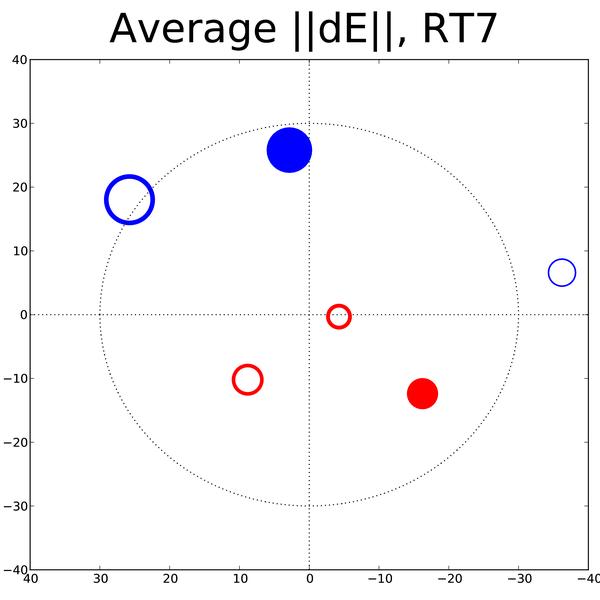
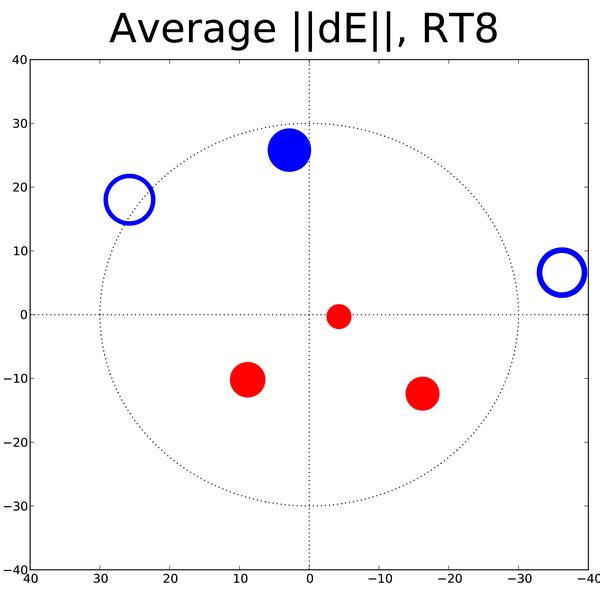
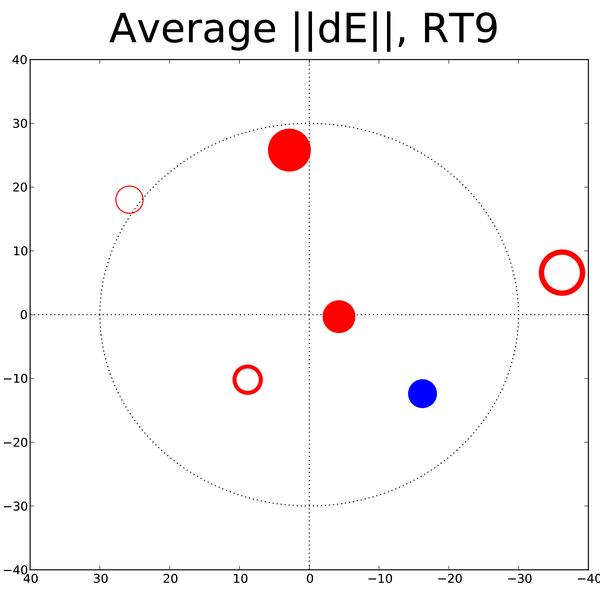
Fig. 9
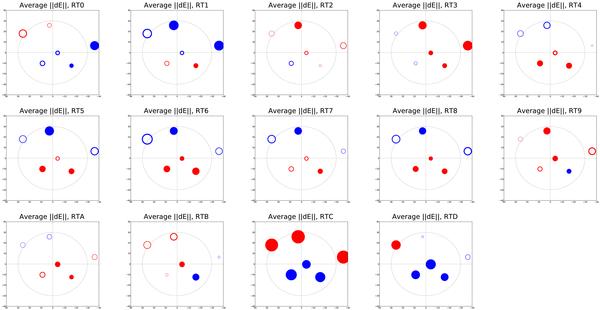
“Rogues gallery” plot for the 2003 observation. This shows the 12-h average ||ΔE|| per source, as seen by each antenna. Blue circles correspond to values of ||ΔE|| > 1, red circles to values of ||ΔE|| < 1, and areas are proportional to | || ΔE|| −1 | . Line thickness indicates the statistical significance of | || ΔE || −1 |; filled circles are for detections of over 3σ. The large grid circle is at radius 30′.

Current usage metrics show cumulative count of Article Views (full-text article views including HTML views, PDF and ePub downloads, according to the available data) and Abstracts Views on Vision4Press platform.
Data correspond to usage on the plateform after 2015. The current usage metrics is available 48-96 hours after online publication and is updated daily on week days.
Initial download of the metrics may take a while.