Fig. 13
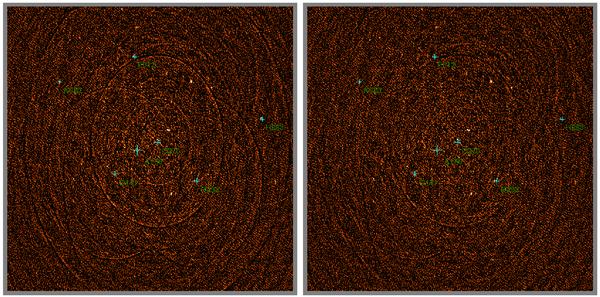
Calibration with an improved sky model. This shows single-band residual images after Gp and Mpq solutions. The left image is from the original reduction, the right image uses a sky model improved via my ΔE analysis. Crosses indicate the positions of sources for which the model was improved, plus 3C 147 itself (source A).
Current usage metrics show cumulative count of Article Views (full-text article views including HTML views, PDF and ePub downloads, according to the available data) and Abstracts Views on Vision4Press platform.
Data correspond to usage on the plateform after 2015. The current usage metrics is available 48-96 hours after online publication and is updated daily on week days.
Initial download of the metrics may take a while.