Fig. 5
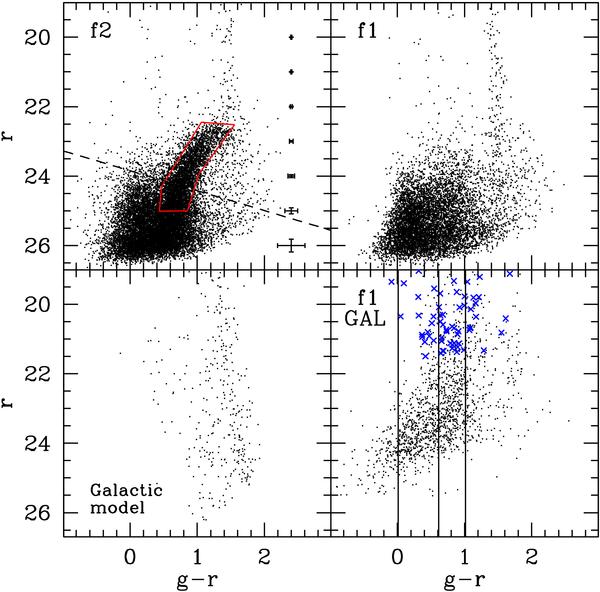
Upper panels: CMDs of the entire Chip 2 (left) and Chip 1 (right) fields. The dashed line marks the limiting magnitude reached in the V, I photometry by K08. The average r, g − r uncertainties are plotted as errorbars. The comparison between the two panels reveals the steep and wide RGB of VV124, tipping at r ≃ 22.5, that dominates the f2 CMD while is completely lacking in the f1 one. The red polygon enclosing the RGB of VV124 is used to select stars for the star counts described in Sect. 4. Lower left panel: predictions of the TRILEGAL Galactic model (Girardi et al. 2005) for a field of the same area as f1 and f2 in the direction of VV124. The model includes only Galactic stars. The effects of photometric uncertainties have been properly added. Lower right panel: CMD of the sources classified as galaxies by Sextractor in f1 (small dots). The blue × symbols are the sources brighter than r = 20.5 classified as galaxies in the SDSS catalogue in the same area. The vertical lines approximately enclose the color range spanned by Red and Blue Sequence galaxies, according to Blanton & Moustakas (2009); see also Balogh et al. (2009).
Current usage metrics show cumulative count of Article Views (full-text article views including HTML views, PDF and ePub downloads, according to the available data) and Abstracts Views on Vision4Press platform.
Data correspond to usage on the plateform after 2015. The current usage metrics is available 48-96 hours after online publication and is updated daily on week days.
Initial download of the metrics may take a while.