Fig. 12
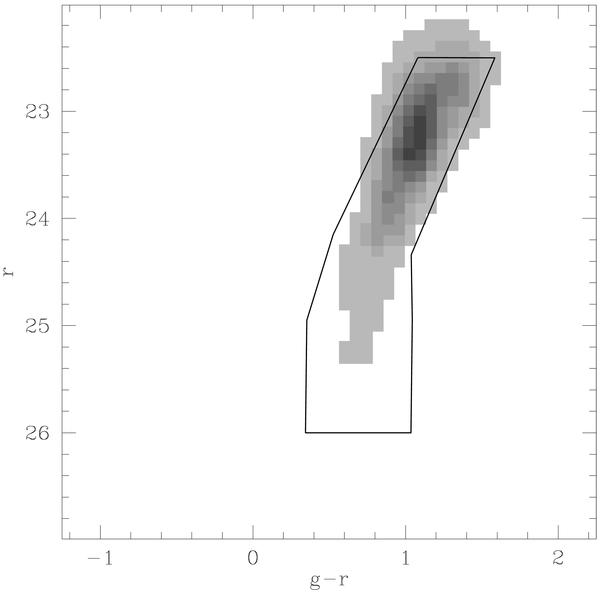
Selection box (continuous line) and weight pattern (in greyscale) adopted for the density maps shown in Fig. 11. Higher weights corresponds to darker grey areas, going from 0.1 (lightest grey) to 1.0 (darkest grey), with step 0.1. Weight = 0.0 is assigned to stars outside the grey area, hence these stars do not contribute to the density estimate.
Current usage metrics show cumulative count of Article Views (full-text article views including HTML views, PDF and ePub downloads, according to the available data) and Abstracts Views on Vision4Press platform.
Data correspond to usage on the plateform after 2015. The current usage metrics is available 48-96 hours after online publication and is updated daily on week days.
Initial download of the metrics may take a while.