Fig. 11
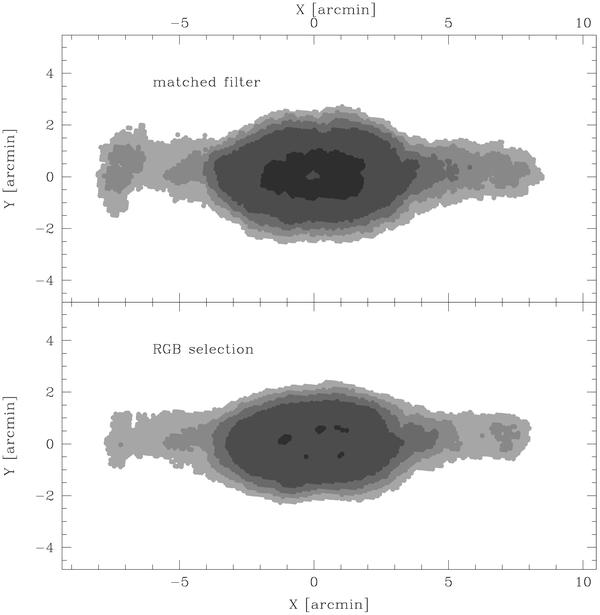
Upper panel: density map obtained with the matched filter (MF) technique, adopting the pattern of weights shown in greyscale in Fig. 12. Lower panel: density map obtained using RGB stars selected to lie within the box shown in Fig. 12. The levels of grey range between 3σ to 8σ above the background, in steps of 1σ, from the lightest to the darkest tone of grey. The density depressions near the center of the main body are due to the low degree of completeness in the very crowded innermost rϵ ≤ 0.5′ region.
Current usage metrics show cumulative count of Article Views (full-text article views including HTML views, PDF and ePub downloads, according to the available data) and Abstracts Views on Vision4Press platform.
Data correspond to usage on the plateform after 2015. The current usage metrics is available 48-96 hours after online publication and is updated daily on week days.
Initial download of the metrics may take a while.