Fig. 2
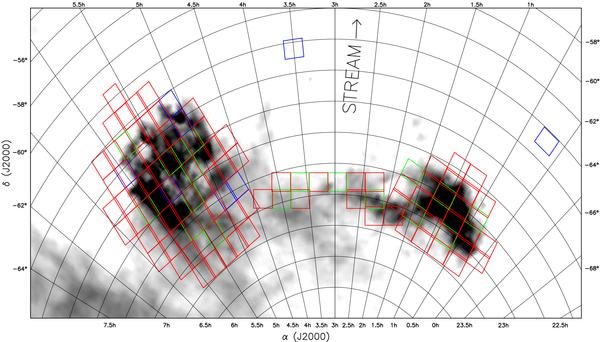
Magellanic system area tiled for VMC observations. The underlying image shows the HI distribution (McClure-Griffiths et al. 2009). VISTA tiles are colour coded as follows. Blue rectangles represent tiles for which observations have started during the dry-runs and P85, green rectangles are for tiles with observations in P86, and red tiles are observations that will not being before P87.
Current usage metrics show cumulative count of Article Views (full-text article views including HTML views, PDF and ePub downloads, according to the available data) and Abstracts Views on Vision4Press platform.
Data correspond to usage on the plateform after 2015. The current usage metrics is available 48-96 hours after online publication and is updated daily on week days.
Initial download of the metrics may take a while.