Free Access
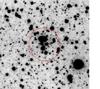
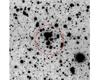
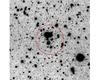
Fig. 14
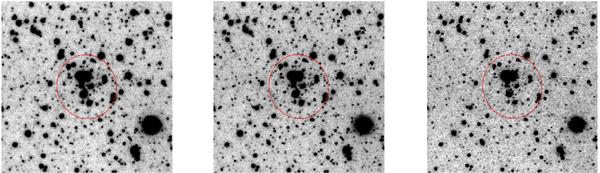
KMHK 1577 observed by VISTA in the Y, J and Ks bands as part of the VMC survey: these images are about 2′ × 2′ in size and refer to 1200, 1400 and ~4000 s of integration, respectively. The ellipse shows the size of the cluster as indicated by Bica et al. (2008).
This figure is made of several images, please see below:
Current usage metrics show cumulative count of Article Views (full-text article views including HTML views, PDF and ePub downloads, according to the available data) and Abstracts Views on Vision4Press platform.
Data correspond to usage on the plateform after 2015. The current usage metrics is available 48-96 hours after online publication and is updated daily on week days.
Initial download of the metrics may take a while.