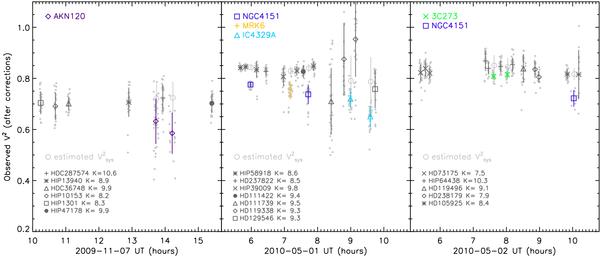
Fig. 1

Observed V2 (after flux-ratio and flux-bias corrections; see Sect. 2.1) plotted against observing time. Gray dots are individual measurements for blocks of 5 s each. These blocks are averaged into scans over a few to several minutes each. These scans are indicated by various symbols with error bars corresponding to statistical errors, calculated as standard deviations of the blocks within each scan. Gray circles are the estimated system V2 at the time of target observations (plotted slightly shifted in time for clarity).
Current usage metrics show cumulative count of Article Views (full-text article views including HTML views, PDF and ePub downloads, according to the available data) and Abstracts Views on Vision4Press platform.
Data correspond to usage on the plateform after 2015. The current usage metrics is available 48-96 hours after online publication and is updated daily on week days.
Initial download of the metrics may take a while.


