Fig. 2
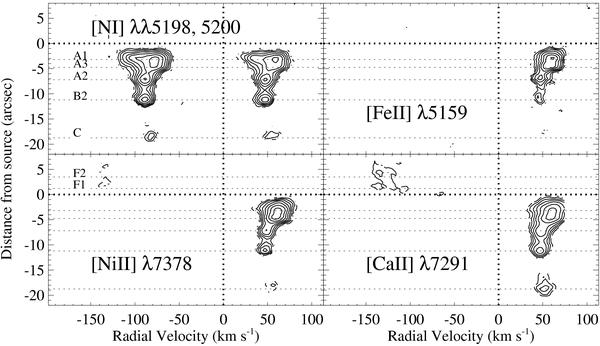
Position-velocity diagrams of the jet from DG Tau B in the [Ni]λλ5198, 5200, [Feii]λ5159, [Niii]λ7378, [Caii]λ7291 emission lines. Note that the velocity scale in the first panel is given with regard to the [Ni]λ5200 line, while the scale for the [Ni]λλ5198 plotted in the same panel is shifted by –136 km s-1 in velocity. Contours are equally spaced in logarithmic scale. The first contour is at 2σ level. The peak level is at 37σ for the [Ni], 24σ for the [Feii], 37σ for the [Niii], and 80σ for the [Caii] line. The vertical and horizontal dotted lines indicate the zero radial velocity with respect to the star and the spatial position of the source. The dashed horizontal lines indicate the position of the detected knots.
Current usage metrics show cumulative count of Article Views (full-text article views including HTML views, PDF and ePub downloads, according to the available data) and Abstracts Views on Vision4Press platform.
Data correspond to usage on the plateform after 2015. The current usage metrics is available 48-96 hours after online publication and is updated daily on week days.
Initial download of the metrics may take a while.