Fig. 1
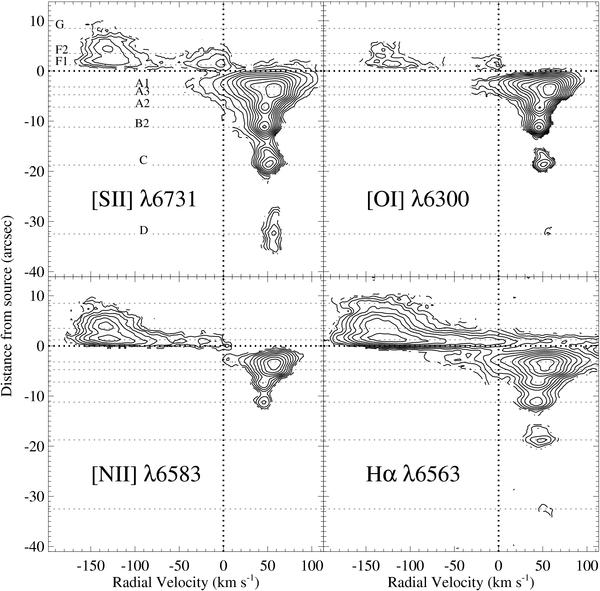
Position-velocity diagrams of the jet from DG Tau B in the strong optical emission lines [Sii]λ6731, [Oi]λ6300, [Nii]λ6583, and Hαλ6563 (angular resolution: FWHMseeing ~ 0.8′′, spectral resolution: FWHMinst ~ 8.8 km s-1). Contours are equally spaced in logarithmic scale. The first contour is at 3σ level for the [Sii], [Oi], and [Nii] lines and at 5σ for the Hα line. The peak level is at 1103σ for the [Sii], 332σ for the [Oi], 115σ for the [Nii], and 131σ for the Hαline. The vertical and horizontal dotted lines indicate the zero radial velocity with respect to the star and the spatial position of the source. The dashed horizontal lines indicate the position of the detected knots.
Current usage metrics show cumulative count of Article Views (full-text article views including HTML views, PDF and ePub downloads, according to the available data) and Abstracts Views on Vision4Press platform.
Data correspond to usage on the plateform after 2015. The current usage metrics is available 48-96 hours after online publication and is updated daily on week days.
Initial download of the metrics may take a while.