Fig. 6
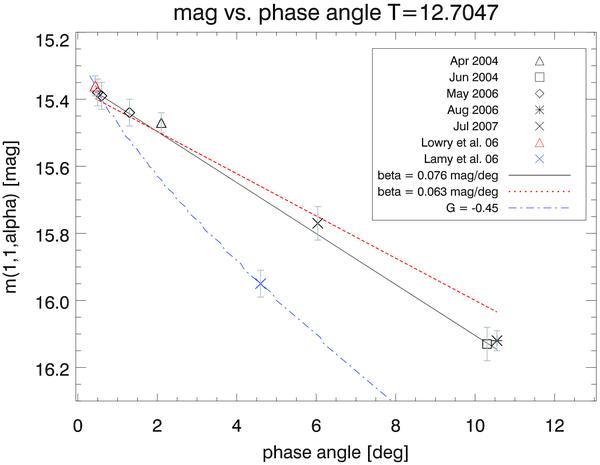
Reduced magnitude vs. phase angle. The values correspond to the mid-point reduced magnitude in the R filter. The different symbols correspond to the different datasets. In addition to our results the mid-point reduced magnitude from Lowry et al. (2006) and Lamy et al. (2006) are shown. The solid line indicates the slope of β = 0.076 mag/°, while the dotted one represents the slope of β = 0.063 mag/°. The blue dashed-dotted line represents the IAU-adopted phase law with G = −0.45 from Lamy et al. (2007).
Current usage metrics show cumulative count of Article Views (full-text article views including HTML views, PDF and ePub downloads, according to the available data) and Abstracts Views on Vision4Press platform.
Data correspond to usage on the plateform after 2015. The current usage metrics is available 48-96 hours after online publication and is updated daily on week days.
Initial download of the metrics may take a while.