Fig. 2
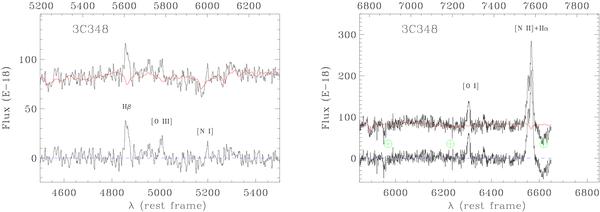
TNG spectrum of 3C 348, an example of a relic RG. The left and right panels are centered on the Hβ and Hα spectral regions, respectively. The original spectra are indicated by the upper solid lines with superimposed we show the best-fit stellar populations model used to subtract the starlight; the lower solid lines are the residual spectra. The flux is given in 10-18 erg cm-2 s-1 Å-1, while the wavelength is in Å, in the rest frame in the lower axis and in the observed frame in the axis above. The three main telluric absorption bands are indicated as circles with a cross inside.
Current usage metrics show cumulative count of Article Views (full-text article views including HTML views, PDF and ePub downloads, according to the available data) and Abstracts Views on Vision4Press platform.
Data correspond to usage on the plateform after 2015. The current usage metrics is available 48-96 hours after online publication and is updated daily on week days.
Initial download of the metrics may take a while.