Free Access
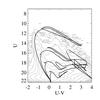
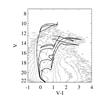
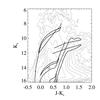
Fig. 1
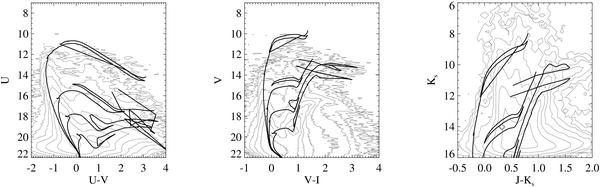
Colour–magnitude diagrams of the SMC from the MCPS (left and middle panel) and 2MASS (right panel). The density levels are logarithmic. Isochrones for 10 Myr, 100 Myr, 300 Myr and 1 Gyr are displayed on top of the contours.
This figure is made of several images, please see below:
Current usage metrics show cumulative count of Article Views (full-text article views including HTML views, PDF and ePub downloads, according to the available data) and Abstracts Views on Vision4Press platform.
Data correspond to usage on the plateform after 2015. The current usage metrics is available 48-96 hours after online publication and is updated daily on week days.
Initial download of the metrics may take a while.