Fig. 5
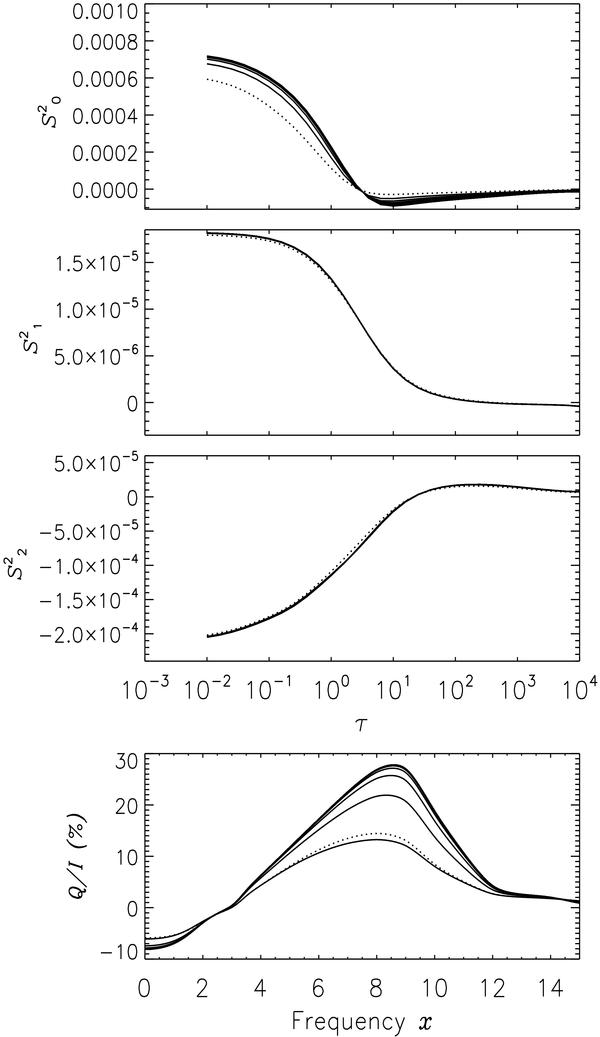
The scattering expansion method. The three
upper panels show the convergence history of the components
 for
x = 0 and μ = 0.025. The last panel
shows the convergence history of the ratio
Q/I. In all the panels, the dotted lines
represent the single scattered solution. The same slab model as in Figs. 3 and 4 is
used.
for
x = 0 and μ = 0.025. The last panel
shows the convergence history of the ratio
Q/I. In all the panels, the dotted lines
represent the single scattered solution. The same slab model as in Figs. 3 and 4 is
used.
Current usage metrics show cumulative count of Article Views (full-text article views including HTML views, PDF and ePub downloads, according to the available data) and Abstracts Views on Vision4Press platform.
Data correspond to usage on the plateform after 2015. The current usage metrics is available 48-96 hours after online publication and is updated daily on week days.
Initial download of the metrics may take a while.