Fig. 5
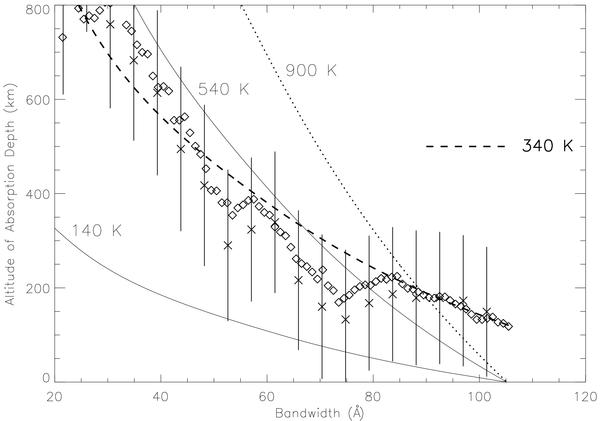
Plot of the absorption altitude as a function of the wavelength band. Measurements of Sing et al. (2008a) are plotted: photometric with crosses and spectroscopic with diamonds. The typical error bars of all evaluations are shown only over the photometric evaluations to avoid confusion. The dashed line shows the best-adjusted IHUA (isothermal hydrostatic and uniform abundance) model to the lowest altitude observations, corresponding to a temperature of 340 K. For comparison the theoretical IHUA models are shown at T = 140 K, 540 K (solid lines), shifted in ordinate toward the lower end of the first error bar at 105 Å in order to show the constraints on the model slopes (not affected by the applied shift) related to the observational error bars. This leads to an estimate of the temperature at the lower levels to be 340 ± 200 K. Similar errors on the order of ± 200 K are found for each observational region of about one scale height (see text). Finally, the 900 K model (dotted line) corresponding to the sodium condensation temperature (see Fig. 1) is also shown to illustrate its incompatibility with the observations.
Current usage metrics show cumulative count of Article Views (full-text article views including HTML views, PDF and ePub downloads, according to the available data) and Abstracts Views on Vision4Press platform.
Data correspond to usage on the plateform after 2015. The current usage metrics is available 48-96 hours after online publication and is updated daily on week days.
Initial download of the metrics may take a while.