Fig. 1
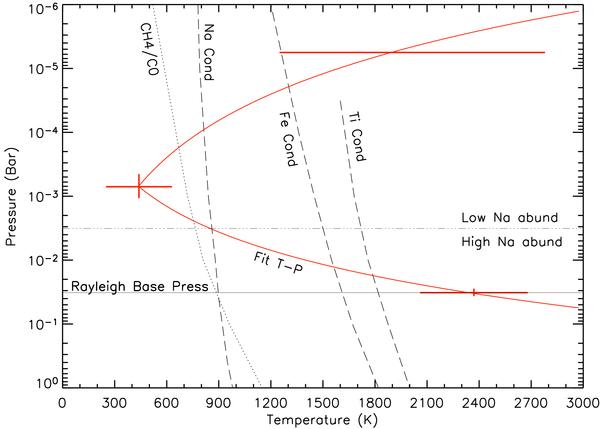
The parametric T-P profile of the atmosphere of HD 209458 b (thick red solid line), as adjusted over HST/STIS observations by Sing et al. (2008b). The three adjusted (T, P) parameters are shown with their temperature error bars (red). The tripled-dot-dashed line shows the level of Na abundance drop at 3 mbar pressure. The thin solid line shows the 32 mbar pressure measured at the base of the sodium absorption line using the Rayleigh scattering. The dotted line shows the CH4/CO equilibrium curve. The dashed lines show the condensation curves for sodium, iron, and titanium.
Current usage metrics show cumulative count of Article Views (full-text article views including HTML views, PDF and ePub downloads, according to the available data) and Abstracts Views on Vision4Press platform.
Data correspond to usage on the plateform after 2015. The current usage metrics is available 48-96 hours after online publication and is updated daily on week days.
Initial download of the metrics may take a while.