Fig. 6
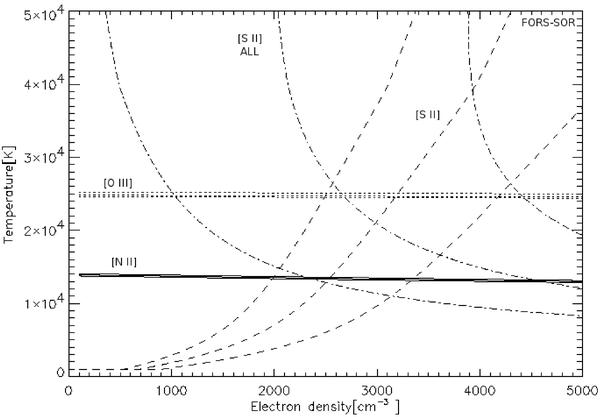
Electron density vs. temperature for dereddened line ratios from the SOR. The data are from the 2002 FORS1 spectrum. The shown lines are: [N II] λλ6548,6581/λ5755 (solid), [O III] λλ4959, 5007/λ4363 (dotted), [S II] λλ4069, 4075/λ6716,6731 (dotted-dashed), and [S II] λ6716/λ6731 (dashed). Each ratio is represent by three curves where the outer curves are for the 1σ statistical uncertainty.
Current usage metrics show cumulative count of Article Views (full-text article views including HTML views, PDF and ePub downloads, according to the available data) and Abstracts Views on Vision4Press platform.
Data correspond to usage on the plateform after 2015. The current usage metrics is available 48-96 hours after online publication and is updated daily on week days.
Initial download of the metrics may take a while.