Fig. 4
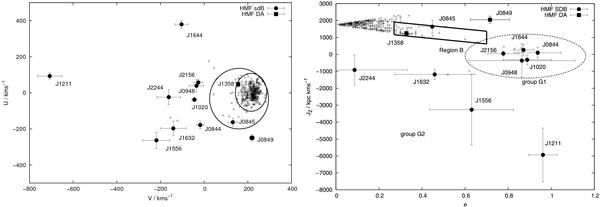
V − U (left) and e-JZ diagram (right) for our 12 targets. The white dwarf sample (+) of Pauli et al. (2006) serves as reference. The solid ellipses render the 3σ-thin and thick disc contours, while the solid box marks the thick disc region (Region B). Ten of our targets are outside of the regions for the two disc populations in both diagrams, but form two distinct groups. The five stars inside the dashed ellipse are called group 1 (G1), while the stars with negative JZ are defined as group 2 (G2).
Current usage metrics show cumulative count of Article Views (full-text article views including HTML views, PDF and ePub downloads, according to the available data) and Abstracts Views on Vision4Press platform.
Data correspond to usage on the plateform after 2015. The current usage metrics is available 48-96 hours after online publication and is updated daily on week days.
Initial download of the metrics may take a while.