Free Access
Fig. 8
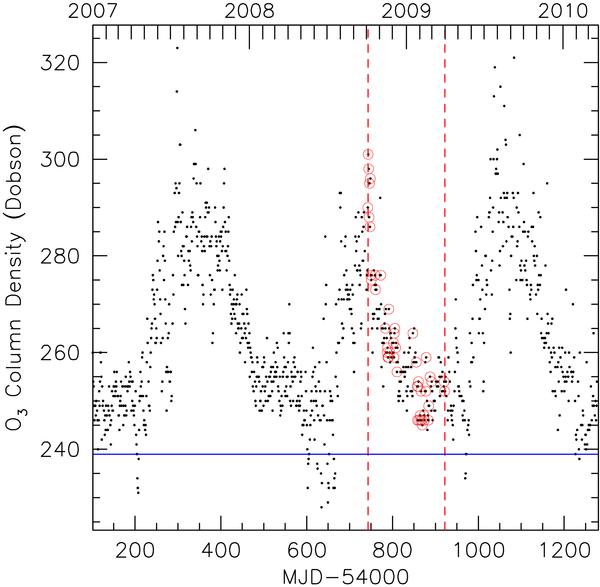
Ozone column density for the Paranal site measured by the Ozone Monitor Instrument on board of AURA. The two vertical dashed lines indicate the time range covered by PARSEC data. The circles mark the dates when PARSEC data were obtained.
Current usage metrics show cumulative count of Article Views (full-text article views including HTML views, PDF and ePub downloads, according to the available data) and Abstracts Views on Vision4Press platform.
Data correspond to usage on the plateform after 2015. The current usage metrics is available 48-96 hours after online publication and is updated daily on week days.
Initial download of the metrics may take a while.