Fig. 6
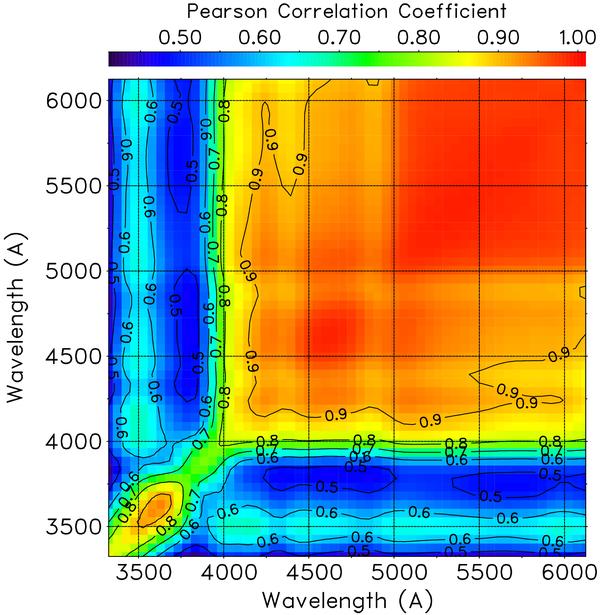
Extinction correlation map for the blue setting. The contours trace the iso-correlation levels. For presentation the map has been smoothed with a Gaussian filter (σ = 75 Å in both directions). The vertical and horizontal strips correspond to the Balmer lines. The decrease of correlation seen along the diagonal between 3700 and 4000 Å is due to the smoothing.
Current usage metrics show cumulative count of Article Views (full-text article views including HTML views, PDF and ePub downloads, according to the available data) and Abstracts Views on Vision4Press platform.
Data correspond to usage on the plateform after 2015. The current usage metrics is available 48-96 hours after online publication and is updated daily on week days.
Initial download of the metrics may take a while.