Fig. 4
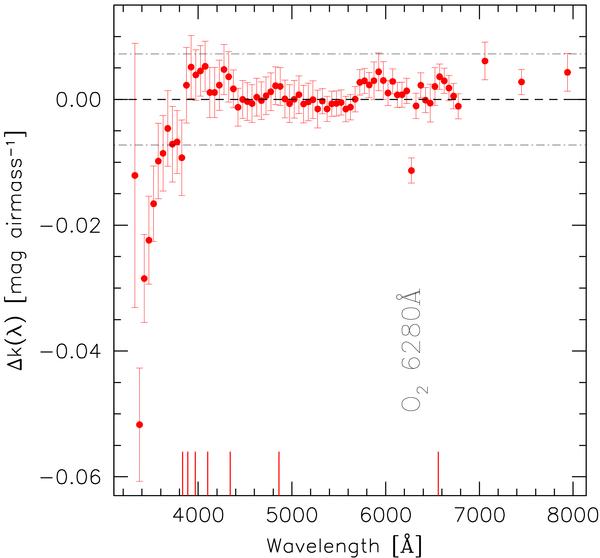
Deviations of the derived extinction curve from the LBLRTM simulation for Cerro Paranal (observed minus model). Errorbars are at the 1-sigma level. The deviation seen at about 6300 Å corresponds to the weak O2 absorption peaking at ~6280 Å. The dotted-dashed lines indicate the 3-sigma deviation from the best fit solution in the range 4000–6800 Å (0.007 mag airmass-1). The vertical segments at the bottom mark the positions of the first 7 Balmer lines.
Current usage metrics show cumulative count of Article Views (full-text article views including HTML views, PDF and ePub downloads, according to the available data) and Abstracts Views on Vision4Press platform.
Data correspond to usage on the plateform after 2015. The current usage metrics is available 48-96 hours after online publication and is updated daily on week days.
Initial download of the metrics may take a while.