Fig. 11
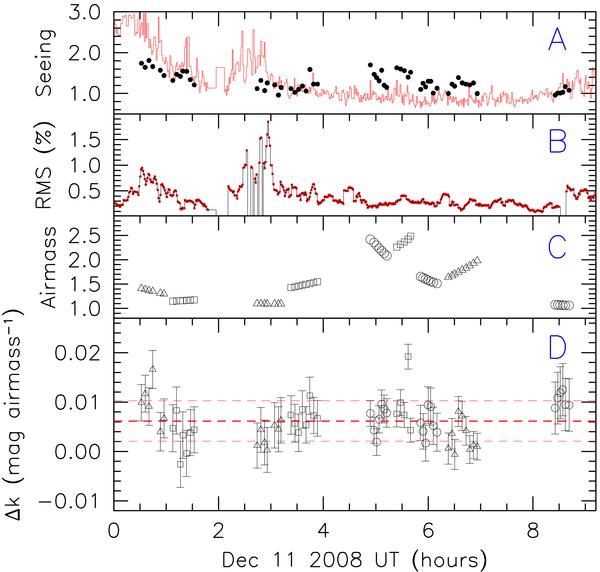
Short timescale variations observed on Dec. 11, 2008 at 5000 Å. Panel A) DIMM seeing (the dots indicate the image quality measured on the spectra). Panel B) LOSSAM rms fluctuations. Panel C) airmass. Panel D deviations from the average extinction at 5000 Å. Different symbols refer to different stars: GD108 (circles), GD50 (triangles), and BPM16274 (squares). The horizontal dashed lines trace the average deviation (middle) and ±1 sigma levels (upper and lower).
Current usage metrics show cumulative count of Article Views (full-text article views including HTML views, PDF and ePub downloads, according to the available data) and Abstracts Views on Vision4Press platform.
Data correspond to usage on the plateform after 2015. The current usage metrics is available 48-96 hours after online publication and is updated daily on week days.
Initial download of the metrics may take a while.