Fig. 8
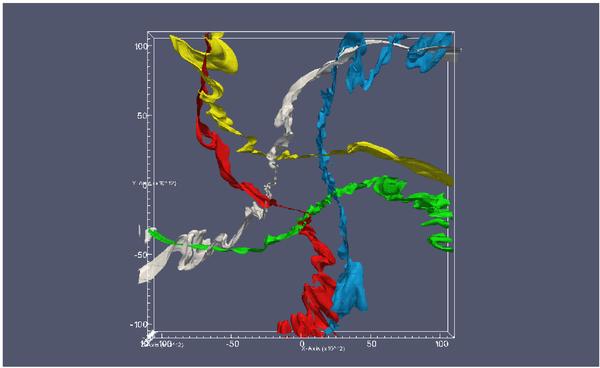
The shell between the LBV and O star at five different points in time, starting 1/5th orbit after Figs. 3–6 (red) and at each 1/5th orbit thereafter (green, blue, yellow) The final shell (white) coincides with the righthand plot in Fig. 7. The shells are defined as an isosurface contour drawn at a velocity of 300 km s-1 (see also Fig. 3). The global shape of the shell remains constant over time, rotating rigidly about the center of mass of the binary (0, 0). Local instabilities vary, but retain the same general characteristics, being small between the stars, but much larger in the advancing and trailing ends of the shell.
Current usage metrics show cumulative count of Article Views (full-text article views including HTML views, PDF and ePub downloads, according to the available data) and Abstracts Views on Vision4Press platform.
Data correspond to usage on the plateform after 2015. The current usage metrics is available 48-96 hours after online publication and is updated daily on week days.
Initial download of the metrics may take a while.