Fig.3
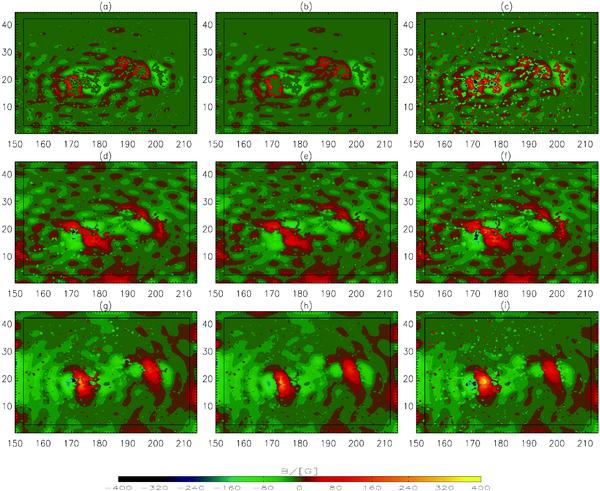
Top row: radial surface vector field difference between a) modelled B without preprocessing and Hobs, b) modelled Bpre and Hobs, c) initial potential and Hobs. Middle row: latitudinal surface vector field difference between d) modelled B without preprocessing and Hobs, e) modelled Bpre and Hobs, and f) initial potential and Hobs. Bottom row: longitudinal surface vector field difference between g) modelled B without preprocessing and Hobs, h) modelled Bpre and Hobs, and i) initial potential and Hobs. The vertical and horizontal axes show latitude, θ and longitude, φ in degree on the photosphere respectively.
Current usage metrics show cumulative count of Article Views (full-text article views including HTML views, PDF and ePub downloads, according to the available data) and Abstracts Views on Vision4Press platform.
Data correspond to usage on the plateform after 2015. The current usage metrics is available 48-96 hours after online publication and is updated daily on week days.
Initial download of the metrics may take a while.