Free Access
Fig.2
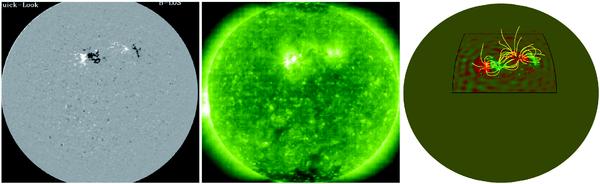
Left: full disc vector magnetogram of May 15 2009 at 16:02UT. Middle: SOHO/EIT image of the Sun on the same day at 16:00 UT. Right: potential magnetic-field line plot of SOLIS vector magnetogram at 16:02 UT, which has been computed from the observed radial component.
Current usage metrics show cumulative count of Article Views (full-text article views including HTML views, PDF and ePub downloads, according to the available data) and Abstracts Views on Vision4Press platform.
Data correspond to usage on the plateform after 2015. The current usage metrics is available 48-96 hours after online publication and is updated daily on week days.
Initial download of the metrics may take a while.