Fig. 8
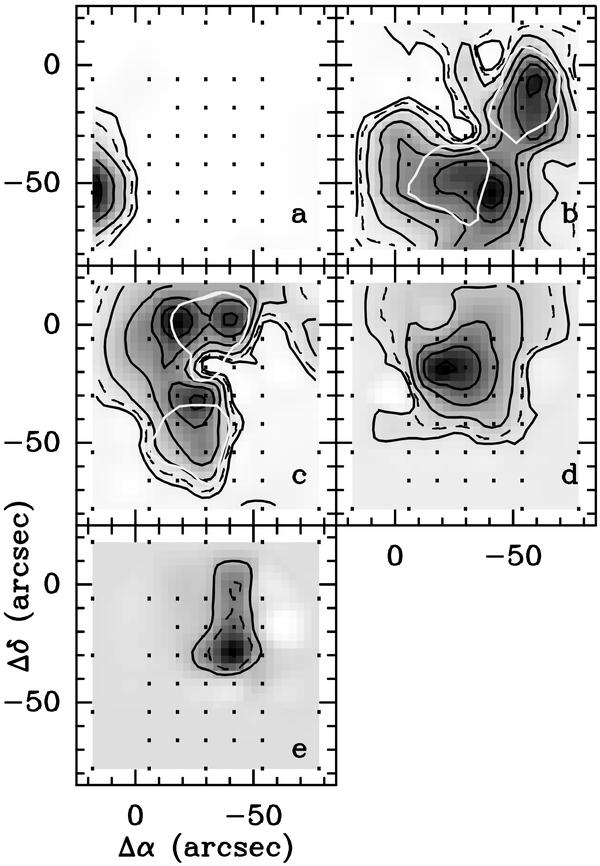
Maps of ∫Tmbdv of the various components contributing to the 13CO(1−0) emission from Region 2 (see Fig. 3b). Each panel shows the integrated emission ∫Tmbdv of a single Gaussian component. Offset (0, 0) as in Fig. 3. Black contours: lowest levels 0.5, 1, and 2 K km s-1, then in steps of 2 K km s-1. For clarity, the 1 K km s-1 contour is drawn dashed; the white polygons in panels b) and c) indicate the FWHM contours of the corresponding Gaussian component of the CS(2−1) emission (see text and Fig. 10). a) Integrated emission of the component between − 17 and − 18 km s-1. b) As a, but for the component between − 18 and − 19 km s-1. c) As a, for the component between − 19 and − 20 km s-1. d) As a, for the component between − 20 and − 21 km s-1. e) As a, for the component between − 21 and − 22 km s-1.
Current usage metrics show cumulative count of Article Views (full-text article views including HTML views, PDF and ePub downloads, according to the available data) and Abstracts Views on Vision4Press platform.
Data correspond to usage on the plateform after 2015. The current usage metrics is available 48-96 hours after online publication and is updated daily on week days.
Initial download of the metrics may take a while.