Fig. 6
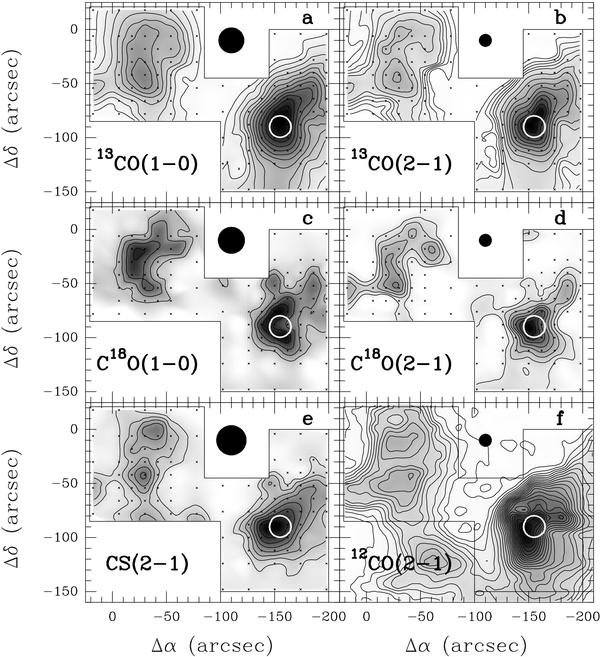
Emission associated with Regions 1 and 2 (see Fig. 3b). The panels show contours and grey scale of ∫Tmbdv (except for 12CO(2−1): ∫ dv), where the integration was performed between − 23 and − 14 km s-1. The molecule and transition are indicated in each panel. The white circle marks the location (but not the size) of the UC H ii region and the embedded cluster. The filled black circle marks the beam size. Offset (0, 0) as in Fig. 3. Contour values are in K km s-1 and are given below in the format lowest (step) highest. a)13CO(1−0); contours: 2(2)26. b)13CO(2−1); contours: 2(2)10 and 14(4)50. c) C18O(1−0); contours: 0.5(0.3)1.7. d) C18O(2−1); contours: 0.9(0.6)6. e) CS(2−1); contours: 0.4(0.25)2.3. f)12CO(2−1); contours 5(5)110.
Current usage metrics show cumulative count of Article Views (full-text article views including HTML views, PDF and ePub downloads, according to the available data) and Abstracts Views on Vision4Press platform.
Data correspond to usage on the plateform after 2015. The current usage metrics is available 48-96 hours after online publication and is updated daily on week days.
Initial download of the metrics may take a while.