Fig. 5
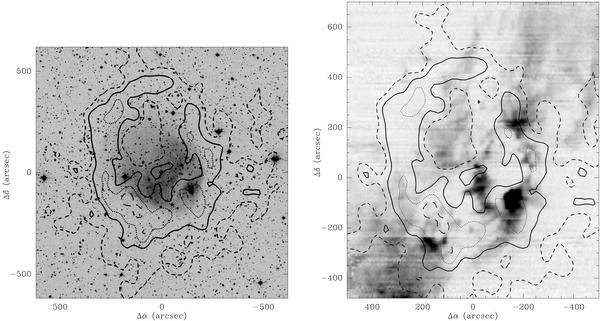
(Left) a) contours of integrated H i line emission ( ; V = − 22.9 to −14.7 km s-1) and the optical image of Sh 2-217 (DSS2). Contour values 520 K km s-1 (short-dash), 570 K km s-1 (continuous), 620 K km s-1 (dotted), and 670 K km s-1 (long-dash). (Right) b) Superimposition of contours of the integrated H i line emission (contours as in left-panel) and a greyscale image of the 12CO(2−1) emission integrated between −23 and −15 km s-1. In both panels, offset (0, 0) as in Fig. 3.
Current usage metrics show cumulative count of Article Views (full-text article views including HTML views, PDF and ePub downloads, according to the available data) and Abstracts Views on Vision4Press platform.
Data correspond to usage on the plateform after 2015. The current usage metrics is available 48-96 hours after online publication and is updated daily on week days.
Initial download of the metrics may take a while.