Fig. 4
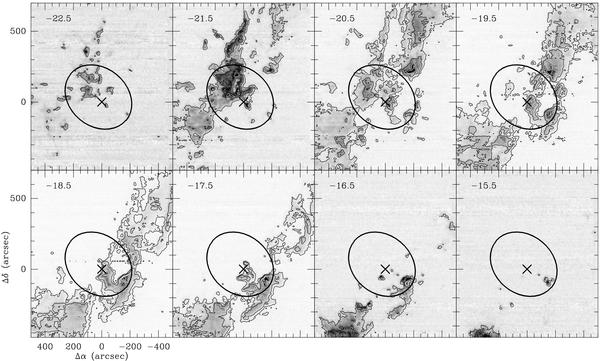
Channel maps of the 12CO(2−1) emission between − 23 and − 15 km s-1 in steps of 1 km s-1. The central velocity of each panel is given in the upper left-hand corner. Lowest contour 2 K km s-1, step size 4 K km s-1; contours of 10 K km s-1 and higher are white. The cross at offset (0, 0) marks the location of the exciting star of Sh 2-217, while the ellipse shows the outline of the optically-visible H ii region.
Current usage metrics show cumulative count of Article Views (full-text article views including HTML views, PDF and ePub downloads, according to the available data) and Abstracts Views on Vision4Press platform.
Data correspond to usage on the plateform after 2015. The current usage metrics is available 48-96 hours after online publication and is updated daily on week days.
Initial download of the metrics may take a while.