Fig. 16
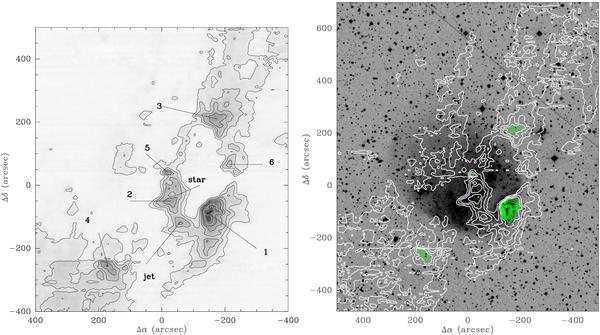
(Left) 12CO(2−1) emission integrated between −21 and −17 km s-1, showing the molecular “ring”. Contour values are from 10 to 80 K km s-1 in steps of 10 K km s-1 (the three highest levels are drawn in white). The three most massive clumps defining the “ring” are marked with numbers 1 − 3; the prominent CO-peak in the SE-cloud is marked with number 4, and minor condensations in the “ring” with 5 and 6. These, as well as “jet” and “star” mark positions towards which we searched for H2O maser emission (see text). (Right) Overlay of  and optical image. The CO-emission is integrated between − 23 and − 15 km s-1. Contour values [lowest(step)highest] are 10(10)40 K km s-1 (white), 50(10)110 K km s-1 (green). In both panels offset (0, 0) as in Fig. 3.
Current usage metrics show cumulative count of Article Views (full-text article views including HTML views, PDF and ePub downloads, according to the available data) and Abstracts Views on Vision4Press platform.
Data correspond to usage on the plateform after 2015. The current usage metrics is available 48-96 hours after online publication and is updated daily on week days.
Initial download of the metrics may take a while.