Fig. 14
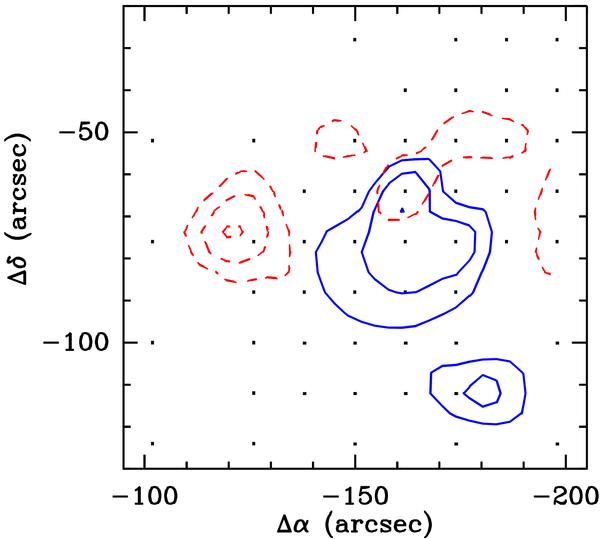
Outflow emission in cluster region. Offset (0, 0) as in Fig. 3. Blue and red wing emission is shown by the drawn and dashed contours, respectively. We show the integrated 13CO(1−0) emission, after subtraction of the fitted Gaussian components from the line profiles. Blue wing: integrated from − 22 to − 19.5 km s-1; red wing: from −17.5 to −15 km s-1. Lowest contour 0.2 K km s-1 (~3σ), step 0.2 K km s-1.
Current usage metrics show cumulative count of Article Views (full-text article views including HTML views, PDF and ePub downloads, according to the available data) and Abstracts Views on Vision4Press platform.
Data correspond to usage on the plateform after 2015. The current usage metrics is available 48-96 hours after online publication and is updated daily on week days.
Initial download of the metrics may take a while.