Fig. 3
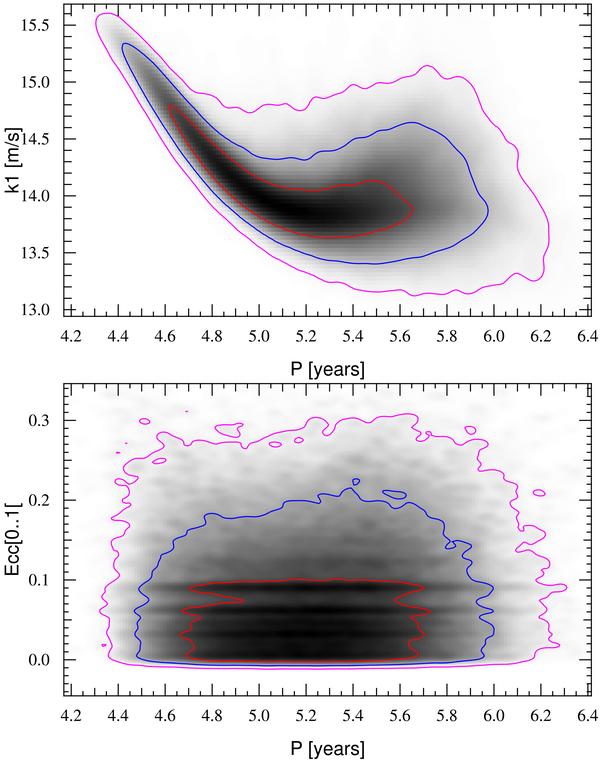
Variations of χ2 as a function of various related parameters of the fit for HD 25171, using Markov-chain simulations. (Top) Correlation plot between the orbital period and radial-velocity semi-amplitude. (Bottom) Correlation plot between eccentricity and orbital period. The lines show 1, 2 and 3-σ iso-contour plots.
Current usage metrics show cumulative count of Article Views (full-text article views including HTML views, PDF and ePub downloads, according to the available data) and Abstracts Views on Vision4Press platform.
Data correspond to usage on the plateform after 2015. The current usage metrics is available 48-96 hours after online publication and is updated daily on week days.
Initial download of the metrics may take a while.