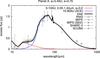
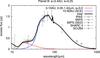
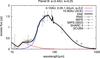
Fig. 8

The entire SED of the ε Eri dust disk. Symbols with error bars are data points, small dots is the IRS spectrum. Thick line in each panel is the excess emission predicted by the models, and thin lines show contributions from the inner region (<10 AU) and the intermediate + outer disk. Three panels are for the planet configurations “A” (top), “B” (middle), and without a planet (bottom).
Current usage metrics show cumulative count of Article Views (full-text article views including HTML views, PDF and ePub downloads, according to the available data) and Abstracts Views on Vision4Press platform.
Data correspond to usage on the plateform after 2015. The current usage metrics is available 48-96 hours after online publication and is updated daily on week days.
Initial download of the metrics may take a while.