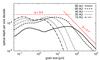
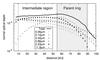
Fig. 4

Left: size distribution at different distances in a disk composed of 70% ice and 30% silicate, simulated with ACE. Curves depict the normal geometrical optical depth per size decade, as a function of size. The straight lines show power laws with q = 3.0 and 3.7 for comparison. (Their height is arbitrary.) Right: radial profiles of the optical depth. Symbols: partial contributions to the optical depth by several selected sizes. Each contribution is normalized to the unit size decade around that size. Solid line: the total optical depth of the disk.
Current usage metrics show cumulative count of Article Views (full-text article views including HTML views, PDF and ePub downloads, according to the available data) and Abstracts Views on Vision4Press platform.
Data correspond to usage on the plateform after 2015. The current usage metrics is available 48-96 hours after online publication and is updated daily on week days.
Initial download of the metrics may take a while.