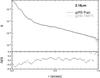
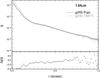
Fig. 6

Mean g function for each star. The error bars correspond to the RMS. The bottom plot represents the absolute relative difference. We can see a larger difference in the core owing to the Strehl variations. From r > r1 the functions are similar at a 9% level in NB_1.64 and at 6% in IB_2.18.
Current usage metrics show cumulative count of Article Views (full-text article views including HTML views, PDF and ePub downloads, according to the available data) and Abstracts Views on Vision4Press platform.
Data correspond to usage on the plateform after 2015. The current usage metrics is available 48-96 hours after online publication and is updated daily on week days.
Initial download of the metrics may take a while.