Fig. 9
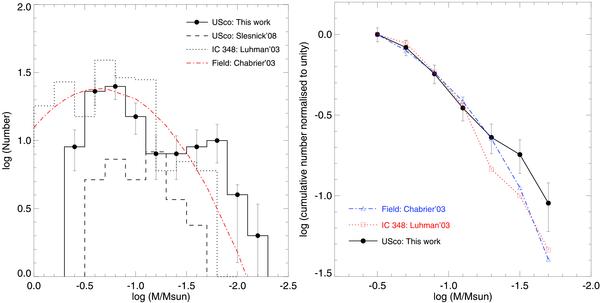
Left: spectroscopic mass function for 6.5 square degree in the central region of USco valid between 0.35 and 0.01 M⊙. Overplotted as a dashed histogram is the spectroscopic mass function (corrected for incompleteness) published by Slesnick et al. (2008) and scaled to an area of 6.5 square degrees. The mass functions in IC 348 and the field are overplotted as a dotted histogram (Luhman et al. 2003b) and dot-dash line (Chabrier 2003), respectively. Right: cumulative distributions (logarithm of sum of the number of objects down to a given mass normalised to unity at the higher mass) for the mass functions in USco (filled dots and black line), IC 348 (open squares and dotted line), and the field (open triangles and dot-dahed line) over the mass range where the USco and IC 348 mass functions are complete. Error bars are included for the USco mass function only.
Current usage metrics show cumulative count of Article Views (full-text article views including HTML views, PDF and ePub downloads, according to the available data) and Abstracts Views on Vision4Press platform.
Data correspond to usage on the plateform after 2015. The current usage metrics is available 48-96 hours after online publication and is updated daily on week days.
Initial download of the metrics may take a while.