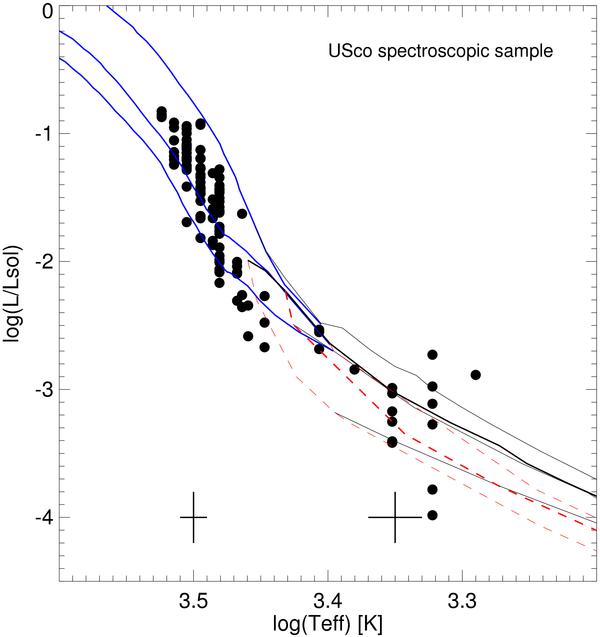
Fig. 8

Hertzsprung-Russell diagram for USco spectroscopic members confirmed at optical wavelengths with AAT/AAOmega in this paper and in the near-infrared with Gemini/GNIRS (Lodieu et al. 2008). Solid lines are NextGen and DUSTY isochrones at 1, 5, and 10 Myr. Dashed lines represent isomasses of 0.05, 0.03, and 0.02 M⊙ from the DUSTY models only (Chabrier et al. 2000). Typical error bars have been added at the bottom of the plot.
Current usage metrics show cumulative count of Article Views (full-text article views including HTML views, PDF and ePub downloads, according to the available data) and Abstracts Views on Vision4Press platform.
Data correspond to usage on the plateform after 2015. The current usage metrics is available 48-96 hours after online publication and is updated daily on week days.
Initial download of the metrics may take a while.


