Fig. 6
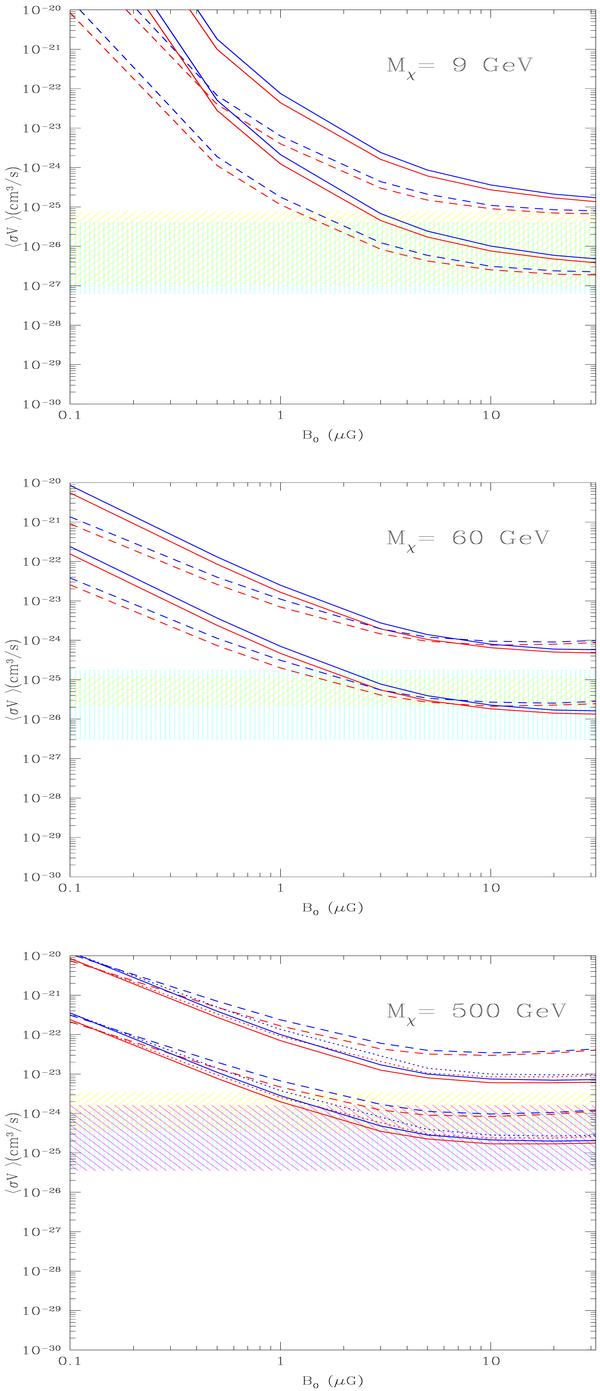
We show the constraints
set by the radio halo spectrum of Coma on the annihilation cross section for the DM
models considered in this paper. Upper, middle, and lower panel refer
to the 9, 60 and 500 GeV neutralino mass, respectively. We consider the case of an NFW
DM profile with  (solid red curve) and τ ± (dashed red curve), and the
case for a cored DM profile with
(solid blue curve) and τ ± (dashed blue curve). The lower
panel also contains the cases of W± composition with NFW (dotted red curve)
and cored DM profile (dotted blue curve). The upper curve bundles refer to a smooth DM
profile, while the lower curve bundles refer to the case where substructures are
considered as in Fig. 1. The shaded bands in this
figure represent the upper limit to the annihilation cross-section for the DM models
derived combining the limits coming from a multi-messenger analysis (see text for
details). The results are obtained using
B(r) ∝ nth(r).
(solid red curve) and τ ± (dashed red curve), and the
case for a cored DM profile with
(solid blue curve) and τ ± (dashed blue curve). The lower
panel also contains the cases of W± composition with NFW (dotted red curve)
and cored DM profile (dotted blue curve). The upper curve bundles refer to a smooth DM
profile, while the lower curve bundles refer to the case where substructures are
considered as in Fig. 1. The shaded bands in this
figure represent the upper limit to the annihilation cross-section for the DM models
derived combining the limits coming from a multi-messenger analysis (see text for
details). The results are obtained using
B(r) ∝ nth(r).
Current usage metrics show cumulative count of Article Views (full-text article views including HTML views, PDF and ePub downloads, according to the available data) and Abstracts Views on Vision4Press platform.
Data correspond to usage on the plateform after 2015. The current usage metrics is available 48-96 hours after online publication and is updated daily on week days.
Initial download of the metrics may take a while.