Fig. 4
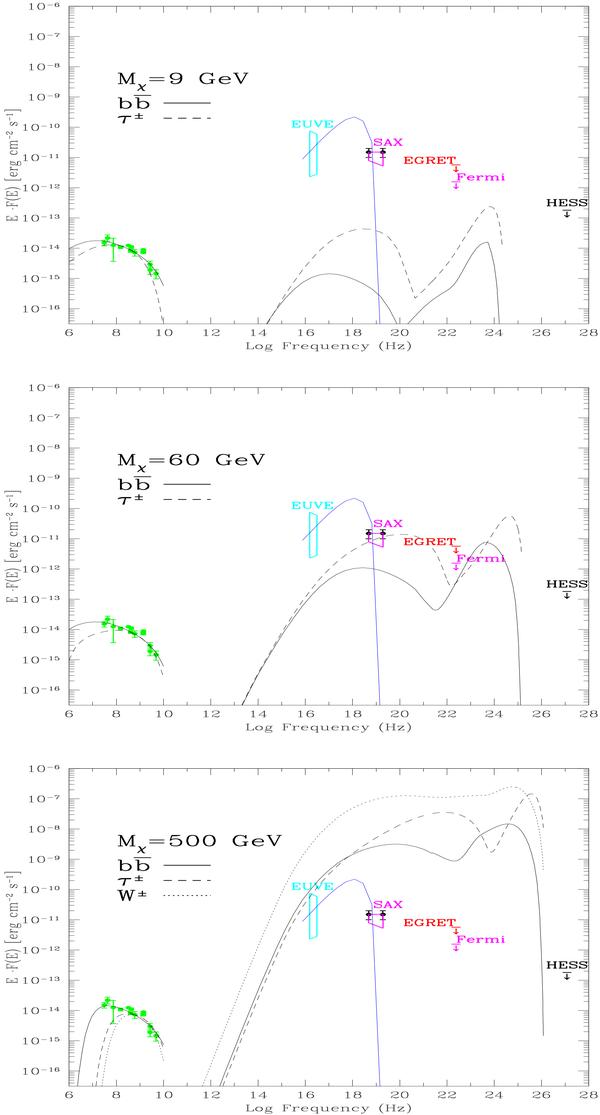
SED of the DM-induced e.m. signals in Coma
as predicted by the three DM models. Upper panel:
Mχ = 9 GeV (solid:
 ;
dashed: τ ± ); mid panel:
Mχ = 60 GeV (solid:
;
dashed: τ ± ); lower panel:
Mχ = 500 GeV (solid:
;
dashed: τ ± ; dotted: W ± )
The values of σV and B0 for the different
models are the same as those used in Fig. 2. The
hatched regions in the X-ray domain represent data from PDS/BeppoSAX (Fusco-Femiano
et al. 2004), HEXTE/RXTE (Rephaeli et al. 1999) and EUVE (Lieu et al. 1999). We also report the EGRET (Reimer et al. 2003), Fermi (Mori 2009) and HESS (Aharonian et al. 2009a) upper limits on Coma. The blue line is a thermal bremsstrahlung model
for Coma with kT = 8.2 keV (Briel et al. 1992). The results are
obtained using
B(r) ∝ nth(r)
and NFW smooth DM profiles, without considering the effect of
substructures.
;
dashed: τ ± ); mid panel:
Mχ = 60 GeV (solid:
;
dashed: τ ± ); lower panel:
Mχ = 500 GeV (solid:
;
dashed: τ ± ; dotted: W ± )
The values of σV and B0 for the different
models are the same as those used in Fig. 2. The
hatched regions in the X-ray domain represent data from PDS/BeppoSAX (Fusco-Femiano
et al. 2004), HEXTE/RXTE (Rephaeli et al. 1999) and EUVE (Lieu et al. 1999). We also report the EGRET (Reimer et al. 2003), Fermi (Mori 2009) and HESS (Aharonian et al. 2009a) upper limits on Coma. The blue line is a thermal bremsstrahlung model
for Coma with kT = 8.2 keV (Briel et al. 1992). The results are
obtained using
B(r) ∝ nth(r)
and NFW smooth DM profiles, without considering the effect of
substructures.
Current usage metrics show cumulative count of Article Views (full-text article views including HTML views, PDF and ePub downloads, according to the available data) and Abstracts Views on Vision4Press platform.
Data correspond to usage on the plateform after 2015. The current usage metrics is available 48-96 hours after online publication and is updated daily on week days.
Initial download of the metrics may take a while.