Fig. 1
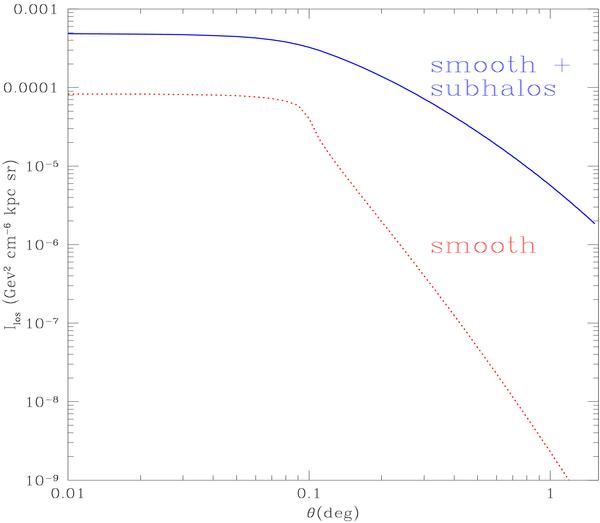
Line of sight integral of the DM density squared is shown as a function of the projected angle from the cluster centre for a resolution of 0.1 degree (corresponding to a solid angle of 10-5 sr). The red dotted curve is for a smooth DM density profile while the blue solid curve is for a smooth DM density profile with the addition of subhalos (see text for details).
Current usage metrics show cumulative count of Article Views (full-text article views including HTML views, PDF and ePub downloads, according to the available data) and Abstracts Views on Vision4Press platform.
Data correspond to usage on the plateform after 2015. The current usage metrics is available 48-96 hours after online publication and is updated daily on week days.
Initial download of the metrics may take a while.