Fig. 6
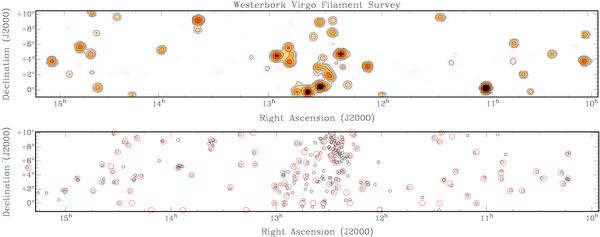
Illustration of the central 110 degrees of the WVFS region and detections in the velocity interval 400 < VHel < 1600 km s-1. The top panel shows the integrated brightness levels, with contour levels drawn at 5, 10, 20, 40, 80 and 160 Jy Beam-1 km s-1. Note that contour levels are chosen very conservatively and do not include faint emission near the noise floor. The second panel shows the position of all known H i-detected galaxies (small black circles) within the redshift range of the WVFS data with the WVFS detections overlaid (large red circles).
Current usage metrics show cumulative count of Article Views (full-text article views including HTML views, PDF and ePub downloads, according to the available data) and Abstracts Views on Vision4Press platform.
Data correspond to usage on the plateform after 2015. The current usage metrics is available 48-96 hours after online publication and is updated daily on week days.
Initial download of the metrics may take a while.