Free Access
Fig. 4
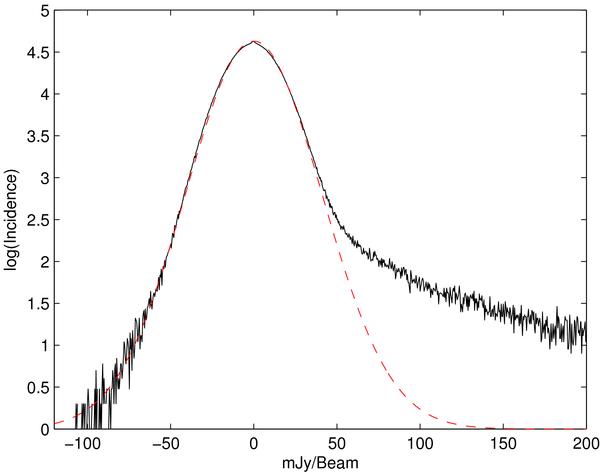
Histogram of the occurrence of brightnesses in the combined data cube on a logarithmic scale. The high brightnesses are dominated by significant emission, but the noise at low brightnesses can be fitted with a Gaussian function with a dispersion that closely agrees with the rms value in emission-free regions.
Current usage metrics show cumulative count of Article Views (full-text article views including HTML views, PDF and ePub downloads, according to the available data) and Abstracts Views on Vision4Press platform.
Data correspond to usage on the plateform after 2015. The current usage metrics is available 48-96 hours after online publication and is updated daily on week days.
Initial download of the metrics may take a while.