Fig. 3
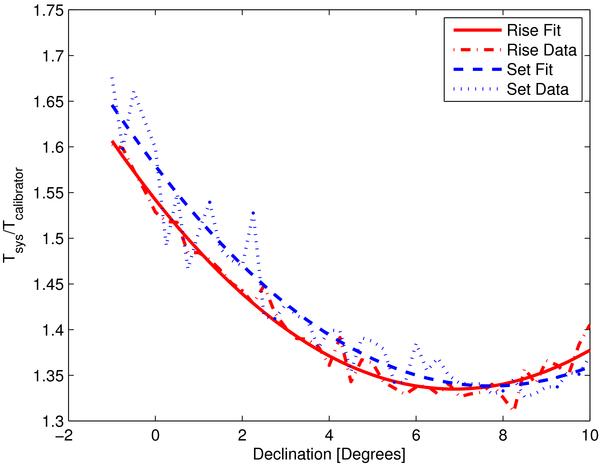
Due to the extreme hour angles at which the observations were taken, there is an increased system temperature with respect to the calibrators. This correction is dependent on the declination. The dash-dotted line represents the calibration factors for the rise data with the best second order polynomial fit shown as a solid line. The dotted line corresponds to the set data, with the fit shown as a short-dashed line.
Current usage metrics show cumulative count of Article Views (full-text article views including HTML views, PDF and ePub downloads, according to the available data) and Abstracts Views on Vision4Press platform.
Data correspond to usage on the plateform after 2015. The current usage metrics is available 48-96 hours after online publication and is updated daily on week days.
Initial download of the metrics may take a while.