Fig. 2
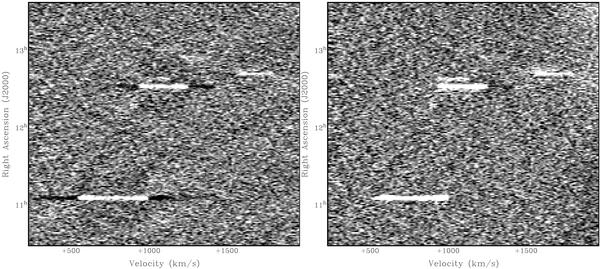
Illustration of the bandpass correction method. In the left panel a robust average over a sliding window in both frequency and position is used to identify the brightest sources of emission. In the right panel the bright sources have been individually masked before carrying out a polynomial fit. Both panels show the same region (declination is zero) on the same intensity scale.
Current usage metrics show cumulative count of Article Views (full-text article views including HTML views, PDF and ePub downloads, according to the available data) and Abstracts Views on Vision4Press platform.
Data correspond to usage on the plateform after 2015. The current usage metrics is available 48-96 hours after online publication and is updated daily on week days.
Initial download of the metrics may take a while.