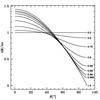
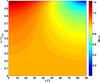
Fig. 2

Left panel: mass-loss rate per surface unit as a function of the co-latitude θ. The pole is on the left, the equator on the right. The mass-loss rate per surface unit is normalised to 1 in the non-rotating case, thus is expressed without units. Right panel: 2D colour plot of the mass-loss rate per surface unit. The x-axis is the co-latitude, the y-axis the rotation parameter ω = Ω/Ωcrit. The colour scale on the right indicates the local mass-loss rate per surface unit, from blue for the lower mass loss flux to red for the higher.
Current usage metrics show cumulative count of Article Views (full-text article views including HTML views, PDF and ePub downloads, according to the available data) and Abstracts Views on Vision4Press platform.
Data correspond to usage on the plateform after 2015. The current usage metrics is available 48-96 hours after online publication and is updated daily on week days.
Initial download of the metrics may take a while.