Fig. 4
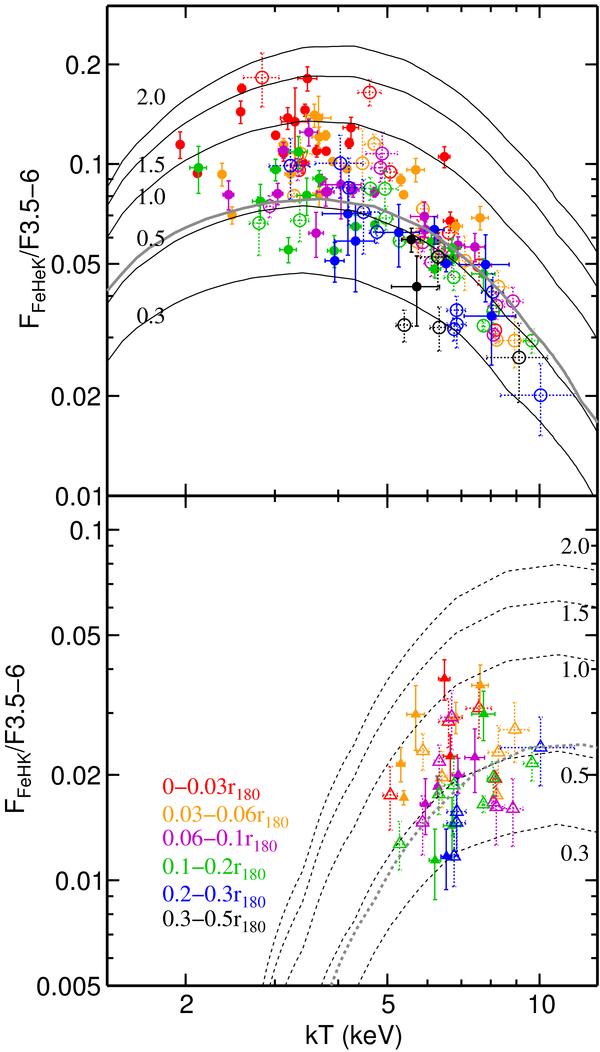
FFeHeK/F3.5−6 (upper panel; circles) and FFeHK/F3.5−6 (lower panel; triangles) at 0−0.03r180 (red), 0.03−0.06r180 (orange), 0.06−0.1r180 (magenta) 0.1−0.2r180 (green), 0.2−0.3r180 (blue), and 0.3−0.5r180 (black), plotted against the ICM temperature. Closed and open symbols indicate cD clusters and non-cD clusters, respectively. Black solid and dotted lines correspond to the theoretical ratios from the APEC model of FFeHeK/F3.5−6 and FFeHK/F3.5−6, respectively, assuming Fe abundance = 0.3, 0.5, 1.0, 1.5, and 2.0 solar. Here, abundance ratios of elements are assumed to have the solar ratios by Lodders (2003). Those of the MEKAL model assuming Fe abundance = 0.5 solar are plotted as gray lines.
Current usage metrics show cumulative count of Article Views (full-text article views including HTML views, PDF and ePub downloads, according to the available data) and Abstracts Views on Vision4Press platform.
Data correspond to usage on the plateform after 2015. The current usage metrics is available 48-96 hours after online publication and is updated daily on week days.
Initial download of the metrics may take a while.