Fig. 6
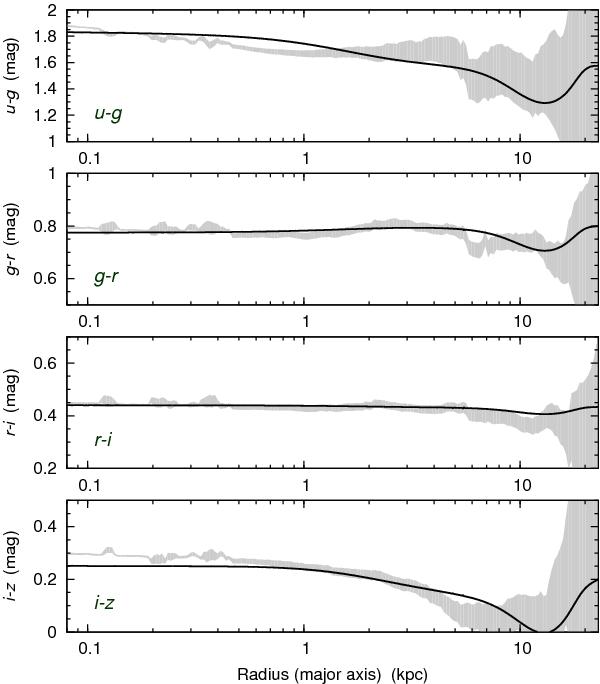
Distribution of the elliptically averaged observed (grey regions) and modelled (solid lines) colour indices for the Sloan filters along the major semi axis. The scatter of the grey region indicates the uncertainty of observations and ellipse fitting. The colour indices are corrected for the absorption in the Milky Way and for the intrinsic absorption of M 31.
Current usage metrics show cumulative count of Article Views (full-text article views including HTML views, PDF and ePub downloads, according to the available data) and Abstracts Views on Vision4Press platform.
Data correspond to usage on the plateform after 2015. The current usage metrics is available 48-96 hours after online publication and is updated daily on week days.
Initial download of the metrics may take a while.