Free Access
Fig. 4
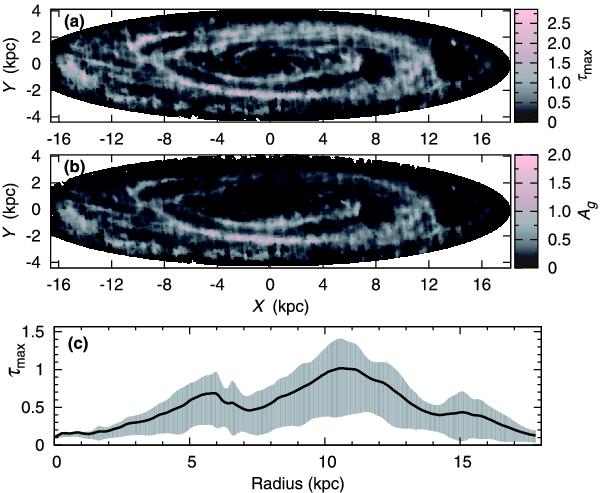
Panel a) map of the total optical depth τmax for the Sloan g filter; panel b) extinction map for the g filter, calculated according to the best-fit model; panel c) the elliptically averaged profile of the optical depth map for the g filter; grey region indicates the scatter of the optical depth along each ellipse.
Current usage metrics show cumulative count of Article Views (full-text article views including HTML views, PDF and ePub downloads, according to the available data) and Abstracts Views on Vision4Press platform.
Data correspond to usage on the plateform after 2015. The current usage metrics is available 48-96 hours after online publication and is updated daily on week days.
Initial download of the metrics may take a while.